Analytics: overview
Analytics brings the numbers from every app together in one place. The new generation: a semantic model (the translator), a drag-and-drop Builder, dashboards you arrange yourself, a library of 50 ready-made KPIs, and one query engine behind them all.
Analytics is the data-analysis app: everything the business records — orders, shipments, deliveries, tickets, money owed and owing — comes together in one place, so managers can see the whole business without opening every app. The new generation is built from five pieces that fit together: a semantic model (a translator between business words and data), a drag-and-drop Builder, dashboards you arrange yourself, a library of 50 ready-made KPIs, and one query engine behind them all — so the same number means the same thing everywhere.
The new Analytics in one picture#
Five pieces that fit together#
- The semantic model — the translator. You only ever see plain-words terms (order amount, order count, status, created date, merchant, client, shipper). You never touch table structures; the model translates your words into what the system can query.
- The Builder — build a report by dragging. Drag fields from the left panel onto the canvas, pick a chart type, click Run. No developer needed.
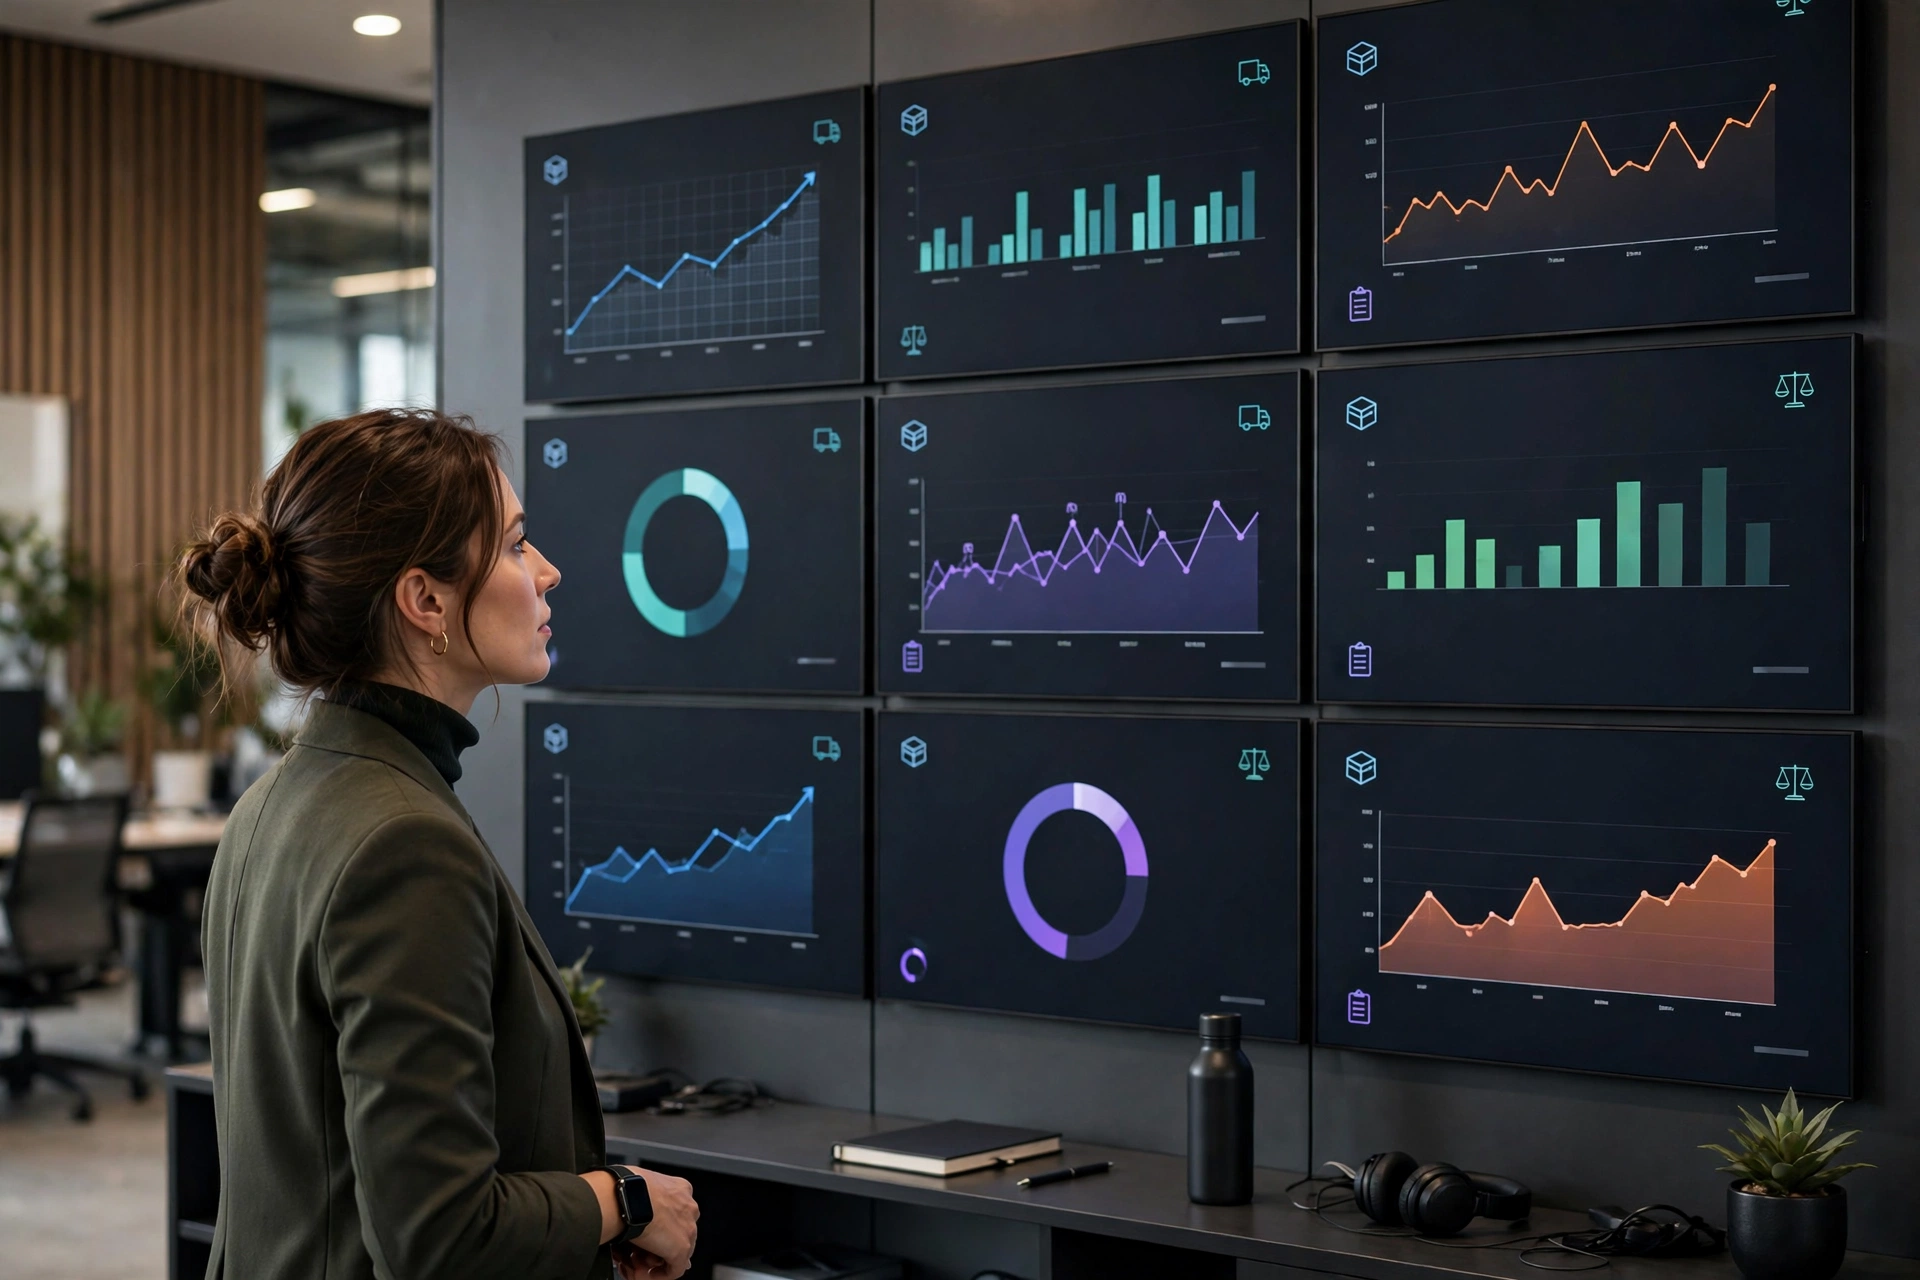
- Dashboards — boards you arrange yourself. KPI cards plus report charts on one page, a global filter bar that filters everything at once, and click-to-cross-filter: tap a chart point and the whole dashboard follows.
- The KPI library — 50 ready-made indicators: picking accuracy, on-time shipment rate, inventory turnover… Each one states its definition in plain words and an industry benchmark. Click a card for the full definition.
- The unified query engine — the same scale for every number. Builder reports, dashboard charts and KPI definitions all query through one engine with one definition, so the same number is never two different values in two places.
Where to click first#
- Open the Analytics app from the app grid and land on the “Overview” tab: the KPI overview, My dashboards, and the preset-dashboard entrance are all here.
- Want to analyze something yourself? Go to the “Reports” tab and click “+ New report” to open the Builder.
- Wondering how an indicator is defined? Open the KPI library, search for it, and read its definition and industry benchmark.